As Google search becomes more reliant on page experience, Foo can help ensure best SEO results by monitoring your websites automatically all day. This post explains how to monitor Lighthouse scores including performance, best practice, SEO, accessibility and PWA. Foo also surfaces Lighthouse lab data metrics including Cumulative Layout Shift (CLS), Largest Contentful Paint (LCP), First Contentful Paint (FCP), Time to Interactive (TTI), Speed Index, and Total Blocking Time (TBT).
The below assumes you've created an account on www.foo.software and are logged in.
Adding and Configuring Pages to Monitor with Lighthouse
In the account dropdown menu from the main navigation at the top, choose "Page Management" or navigate directly to https://www.foo.software/dashboard/pages/manage.
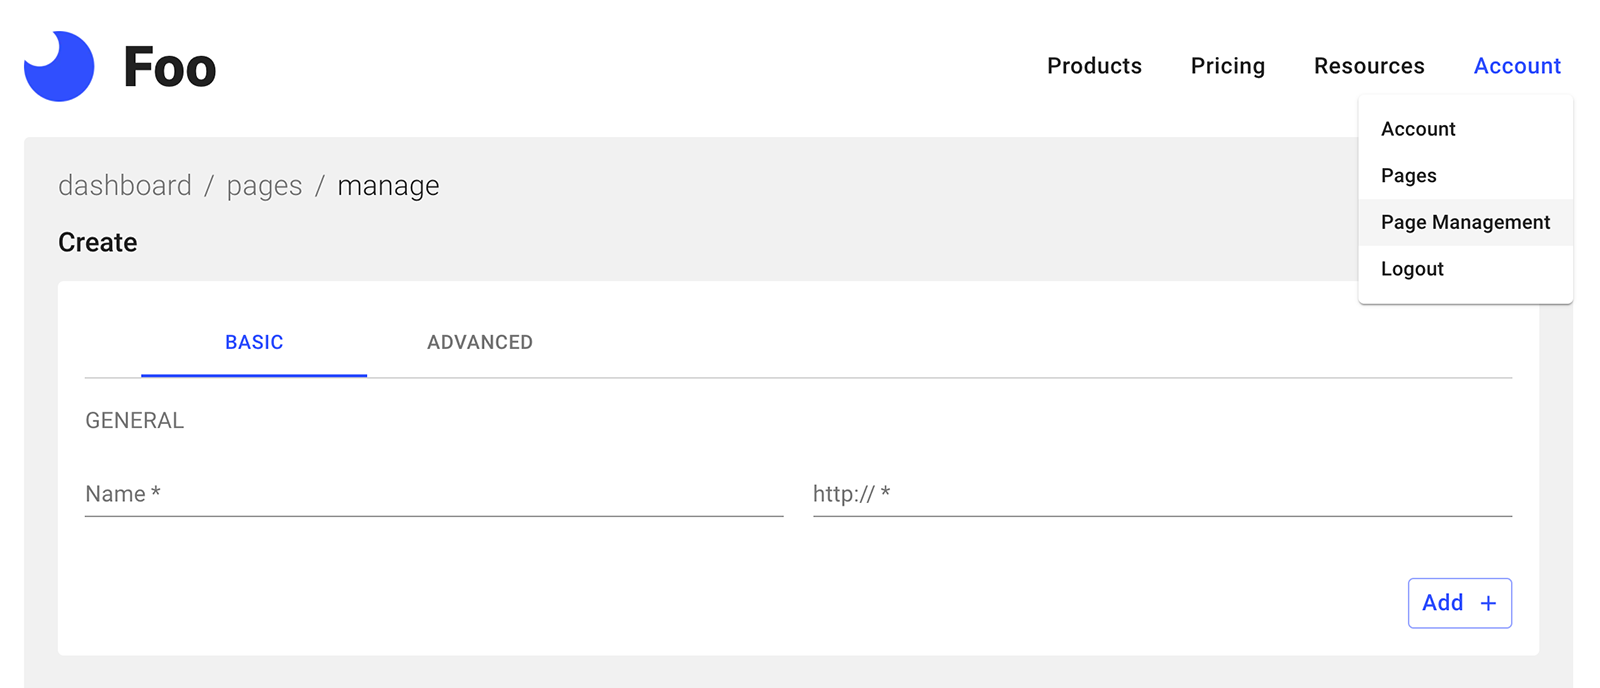
From this screen, give your page a name that you and your team will recognize when searching and sorting, etc. Fill in the required URL field also. Next, you can add any optional, custom configuration by clicking the "advanced" tab.
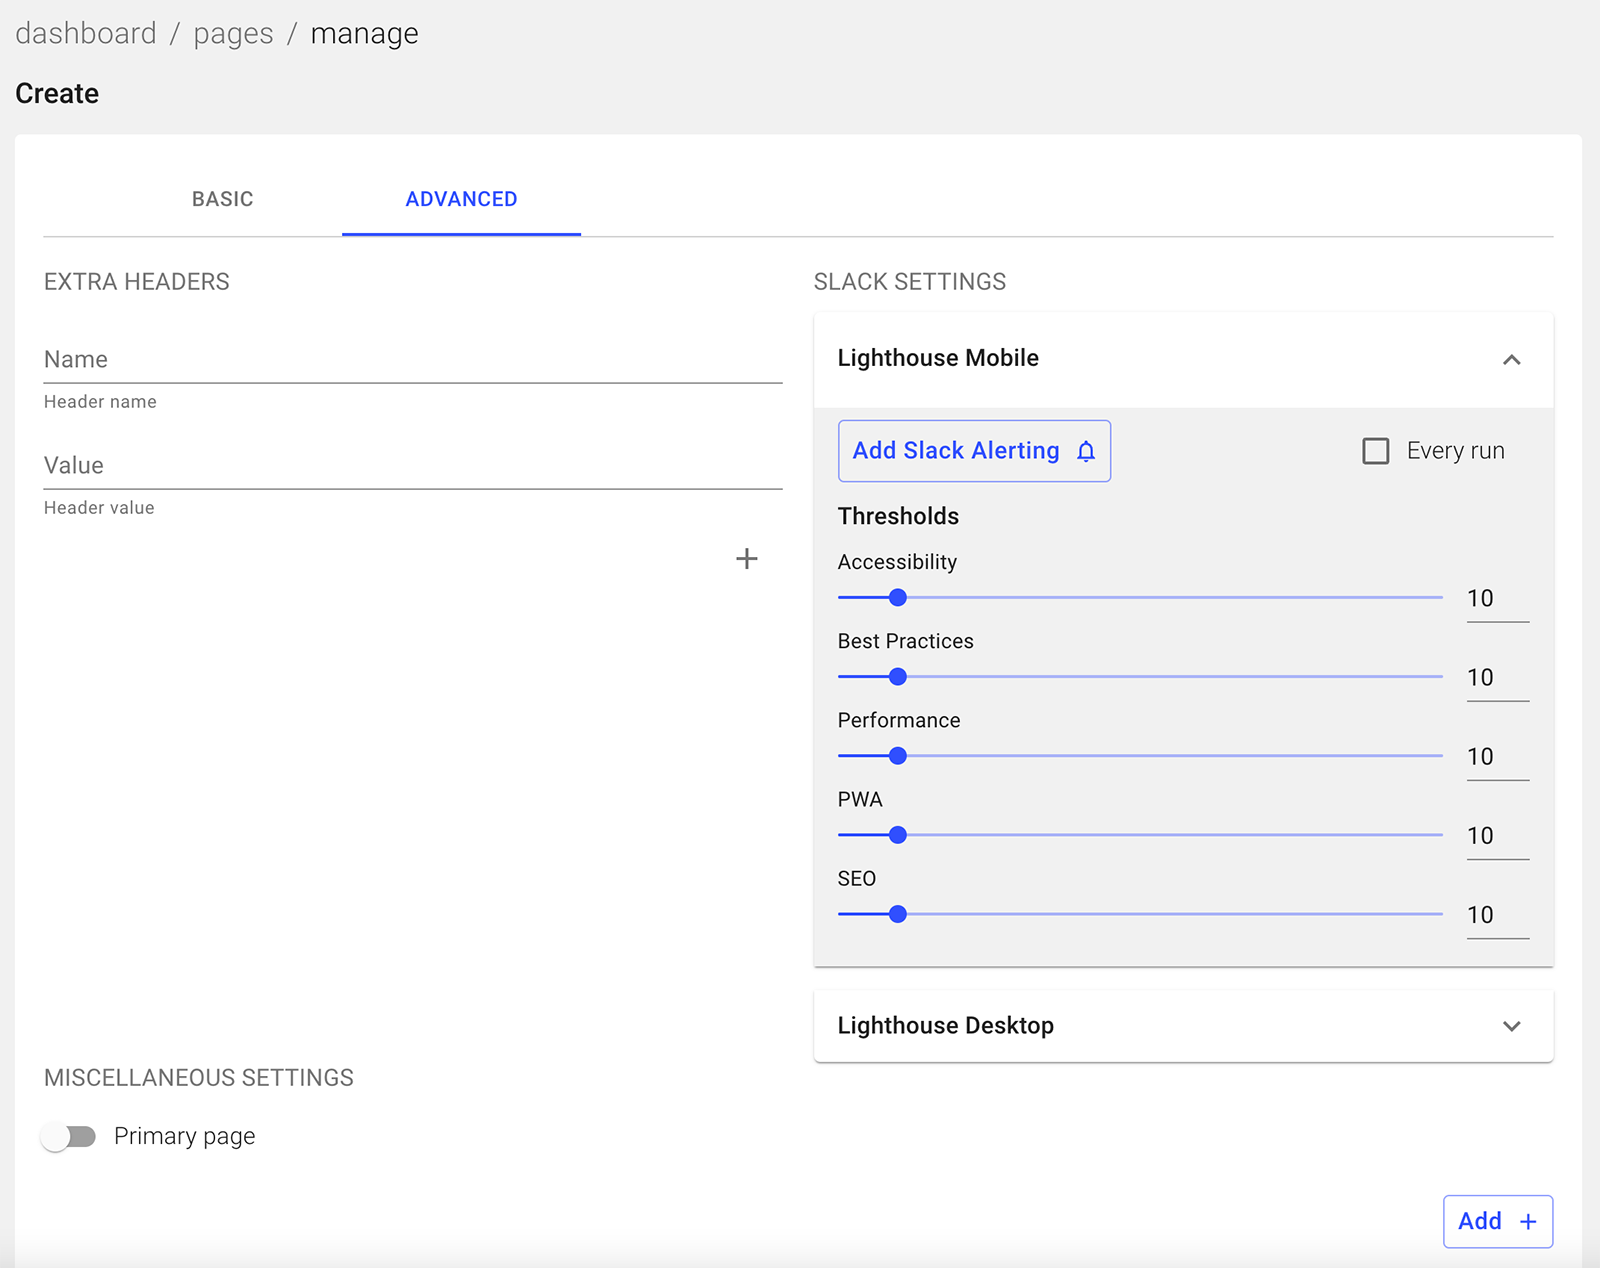
From here you can configure a few settings as detailed below.
Extra Headers
Here you can add header key / value pairs for Lighthouse to send as part of the request to the web page. Be careful, invalid errors may cause Lighthouse failure. Arbitrary keys should be prefixed with an x- like x-lighthouse .
Miscellaneous Settings
In this section, currently there is only one setting - "primary page" toggle. The "primary page" toggle will simply enable a page to be the default in your dashboard and prioritized in other ways throughout the dashboard UI.
Slack Settings
From here you can add a Slack connection or utilize an existing one that connects to a Slack channel or user direct message. By making this connection at the page level, any Lighthouse audit associated with it will post to the connected Slack channel a notification regarding results of the Lighthouse audit. This notification will be sent only if a score falls within the configured thresholds. These thresholds are configured in this section of the page management dashboard and will trigger notifications for the following scenarios. Let's assume each audit is configured with the default as 10.
- An audit score above the most recent 20 run average by 10 points (or the configured number of points): Sends a notification that scores have improved for the given audit (performance is an audit, for example). Consecutive improvements thereafter will not trigger a notification unless preceded by a dip to normal range.
- An audit score below the most recent 20 run average by 10 points (or the configured number of points): Sends a notification that scores have degraded for the given audit.
- An audit score with a previous run below the most recent 20 run average by 10 points (or the configured number of points) as detailed above is followed by an improvement within the average range: Sends a notification that scores returned to normal for the given audit.
If we check off "every run", we will receive a Slack notification with all scores on every Lighthouse audit and none of the above will apply.
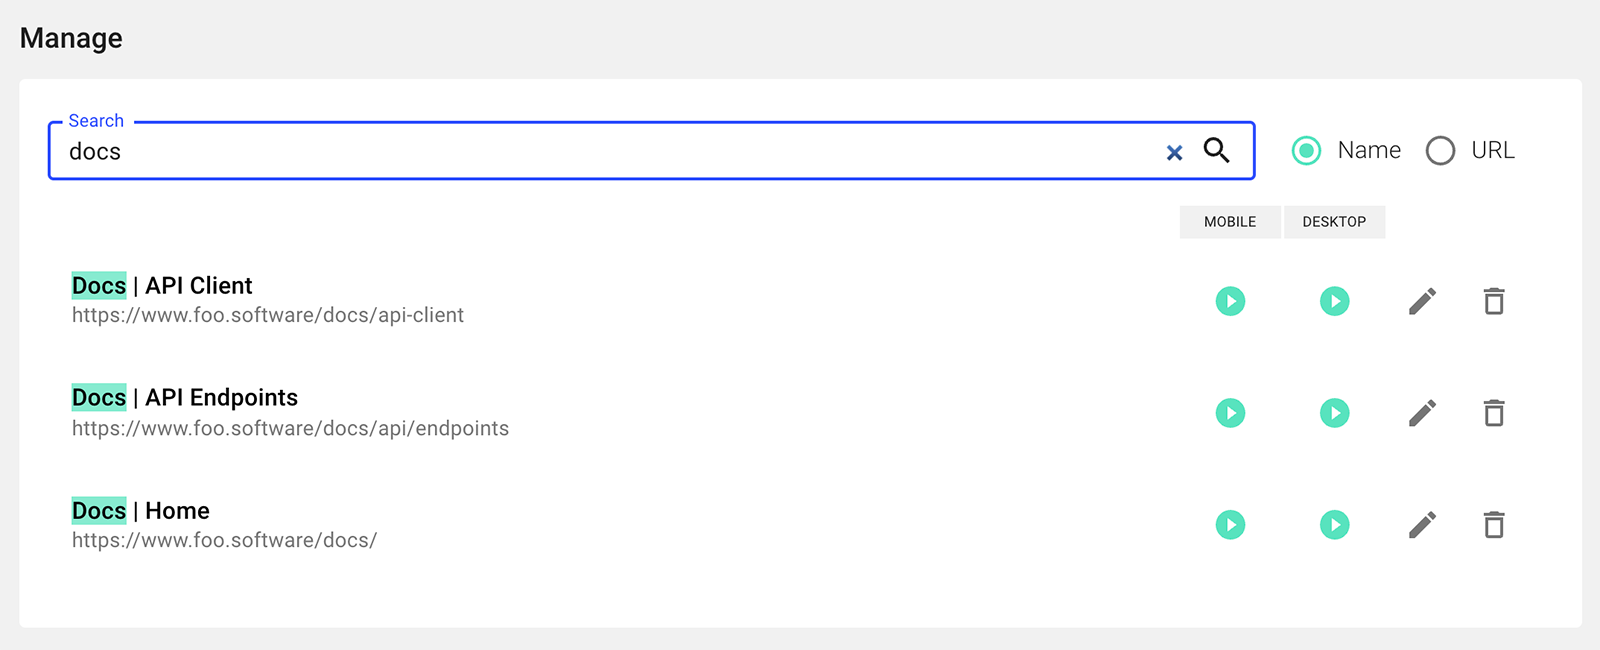
Managing Pages to Monitor with Lighthouse
In the manage section at the bottom of page management you can manually trigger Lighthouse audits by clicking the play button under the corresponding device column ("mobile" or "desktop"). You can edit or delete pages via pencil icon (edit) and trash icon (delete) respectively. By populating the search bar, you can filter pages by URL or name.
Viewing Lighthouse Results in the Page Dashboard
In the account dropdown menu from the main navigation at the top, choose "Pages" or navigate directly to https://www.foo.software/dashboard/pages.
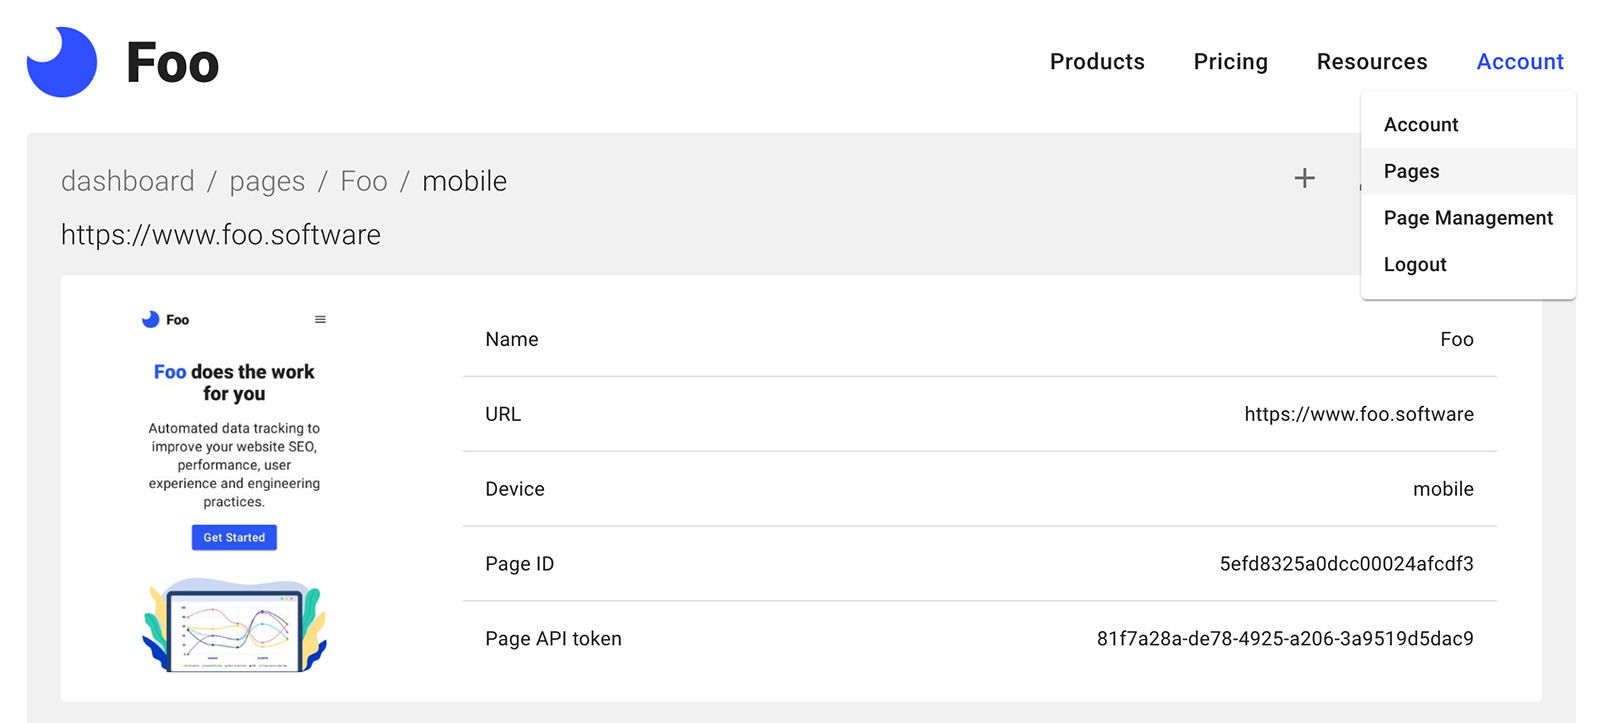
The pages dashboard is the entry point to view Lighthouse results of pages you've added on Foo. By default we show the "primary" page (as configured in the above sections).
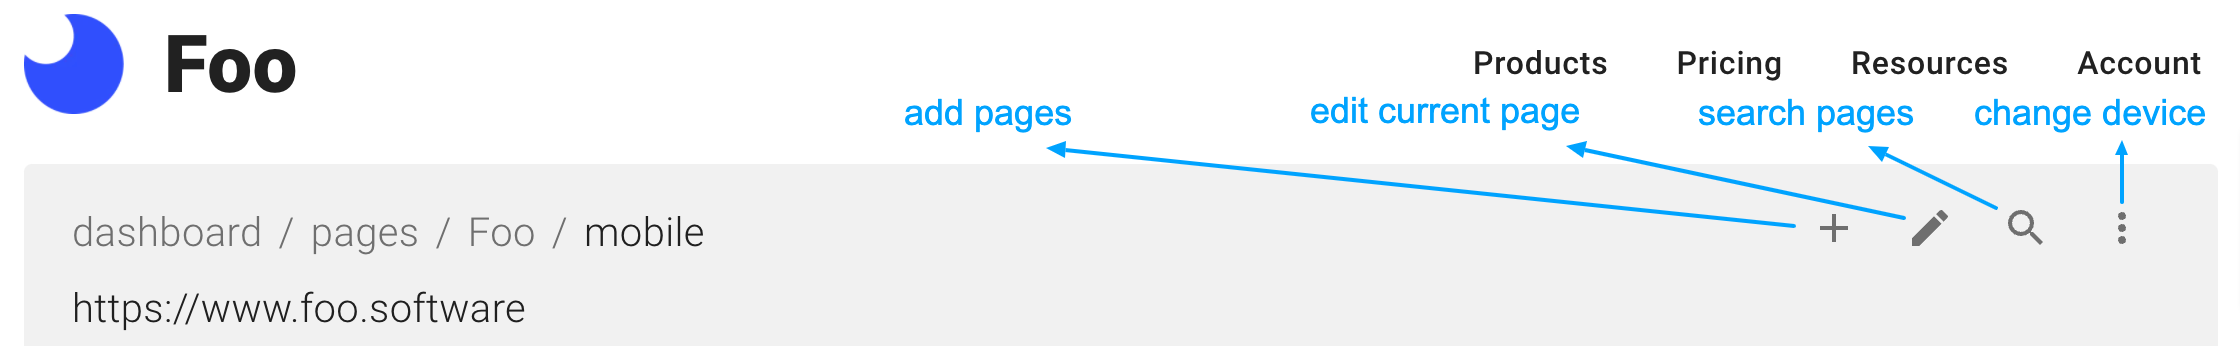
At the top we display basic info about the page. From the sub-navigation at the top right, you can switch device to show results for ("desktop" or "mobile"), add pages, edit the current page, or search for other pages.
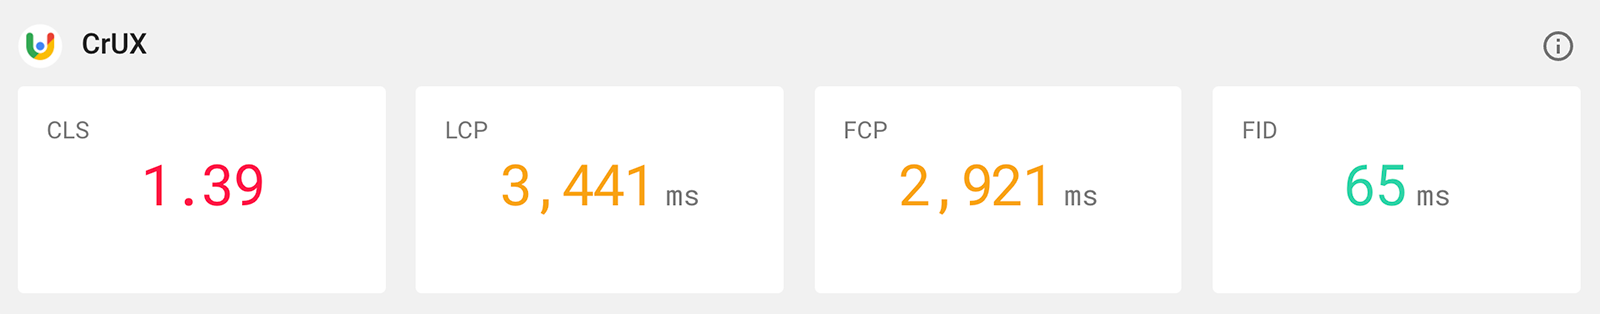
Page Dashboard: CrUX Section
The CrUX section displays data Google has gathered from website pages it determines to have significant traffic. At the time of this writing it's unclear how Google makes this determination, but it is clear that not all pages will have data. www.foo.software hasn't made the cut yet apparently 🥺. Data is based on the 75th percentile of page loads. Refer to Chrome User Experience Report (CrUX) documentation to learn more.
Page Dashboard: Lighthouse Section
The Lighthouse section displays the most recent 2 weeks of results for all audits including performance, SEO, accessibility, best practice, and PWA. To see a more detailed view, with the ability to change the timeframe or view detailed reports, click the chart icon at the top right of this section. You can also manually trigger a new Lighthouse audit by clicking the "enqueue" button.
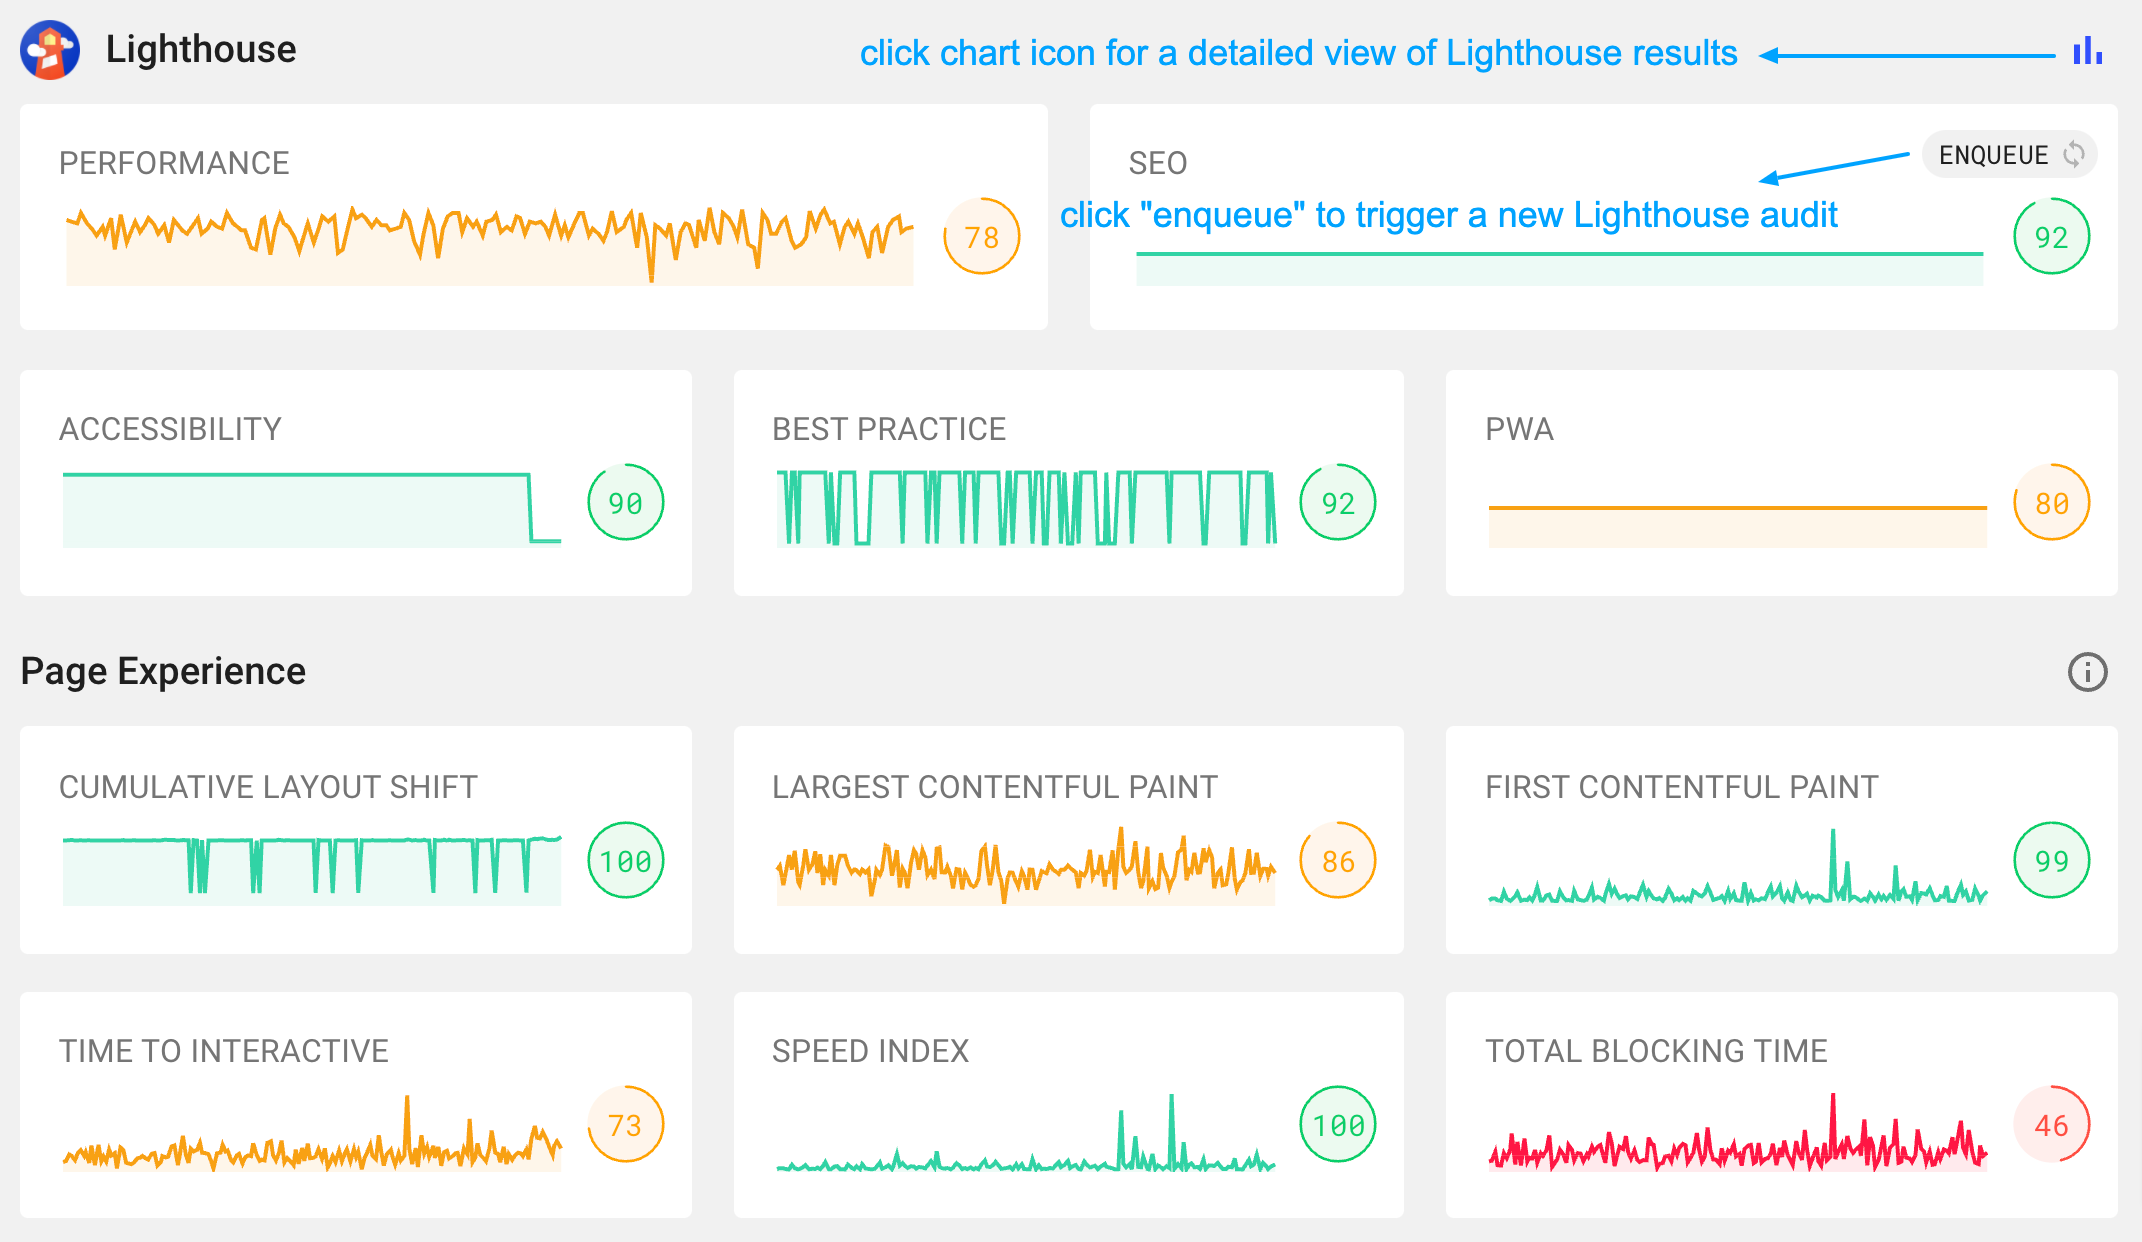
In addition to audit scores we also surface scores and actual performance audit metric scores and values. We refer to this metric set as "page experience" because some overlap with Google's "Web Vitals" metrics set.
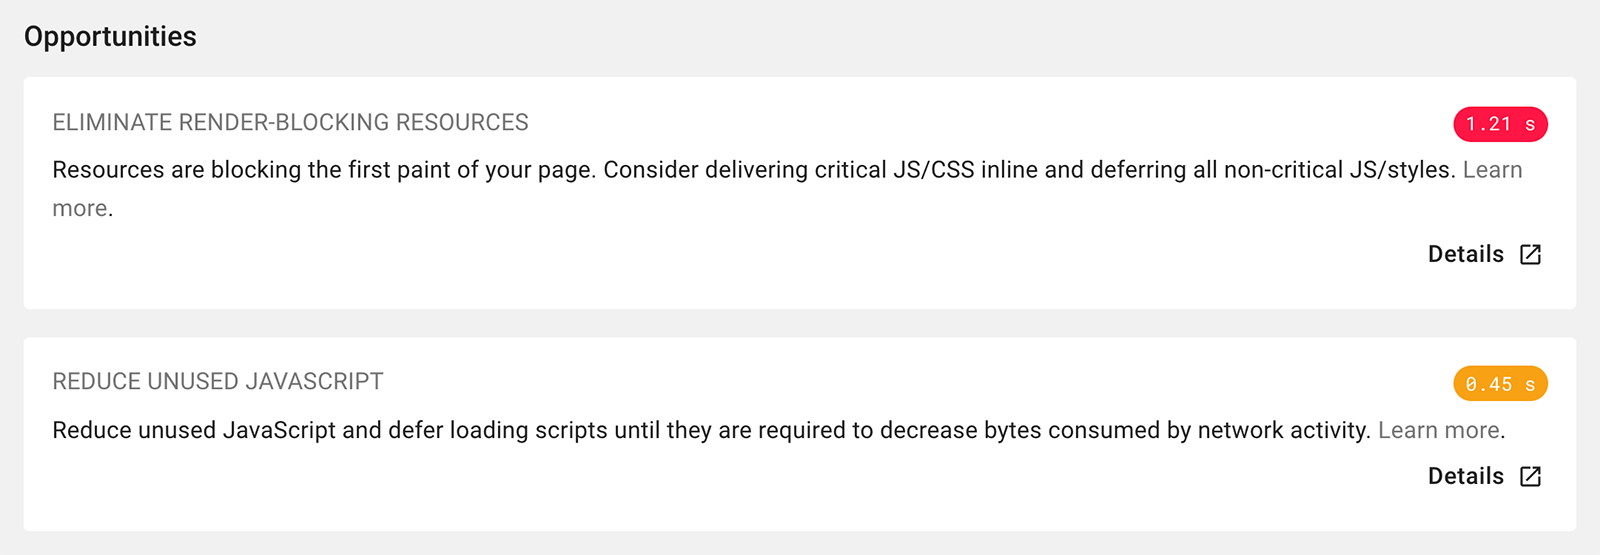
Page Dashboard: Opportunities Section
In the opportunities section we surface "opportunities" directly from the most recent Lighthouse audit.
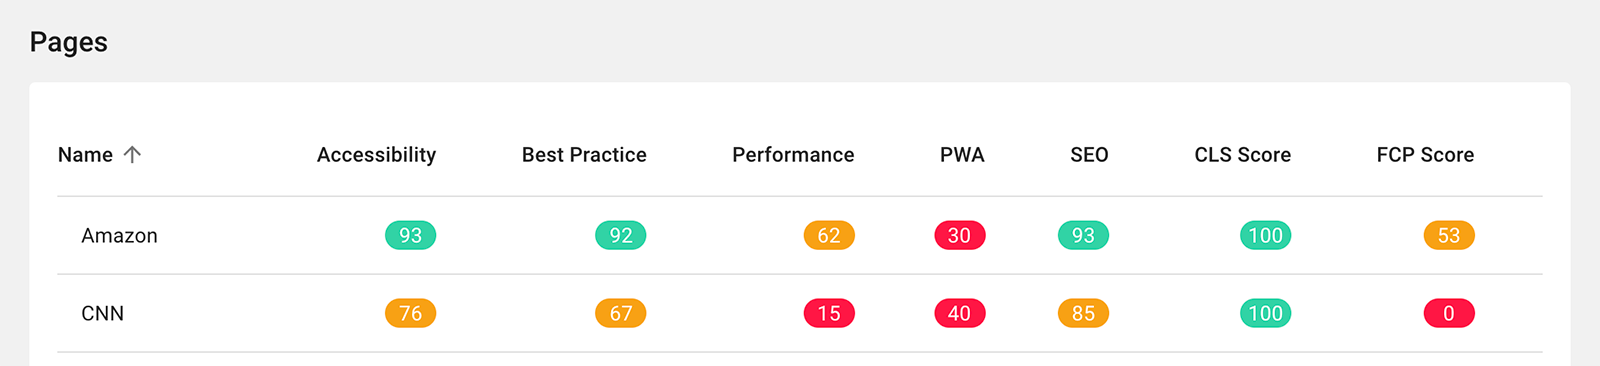
Page Dashboard: Pages Table
The pages table is meant to provide a high level view of data for all pages, including scores from audits and metrics, sorting capability, etc.
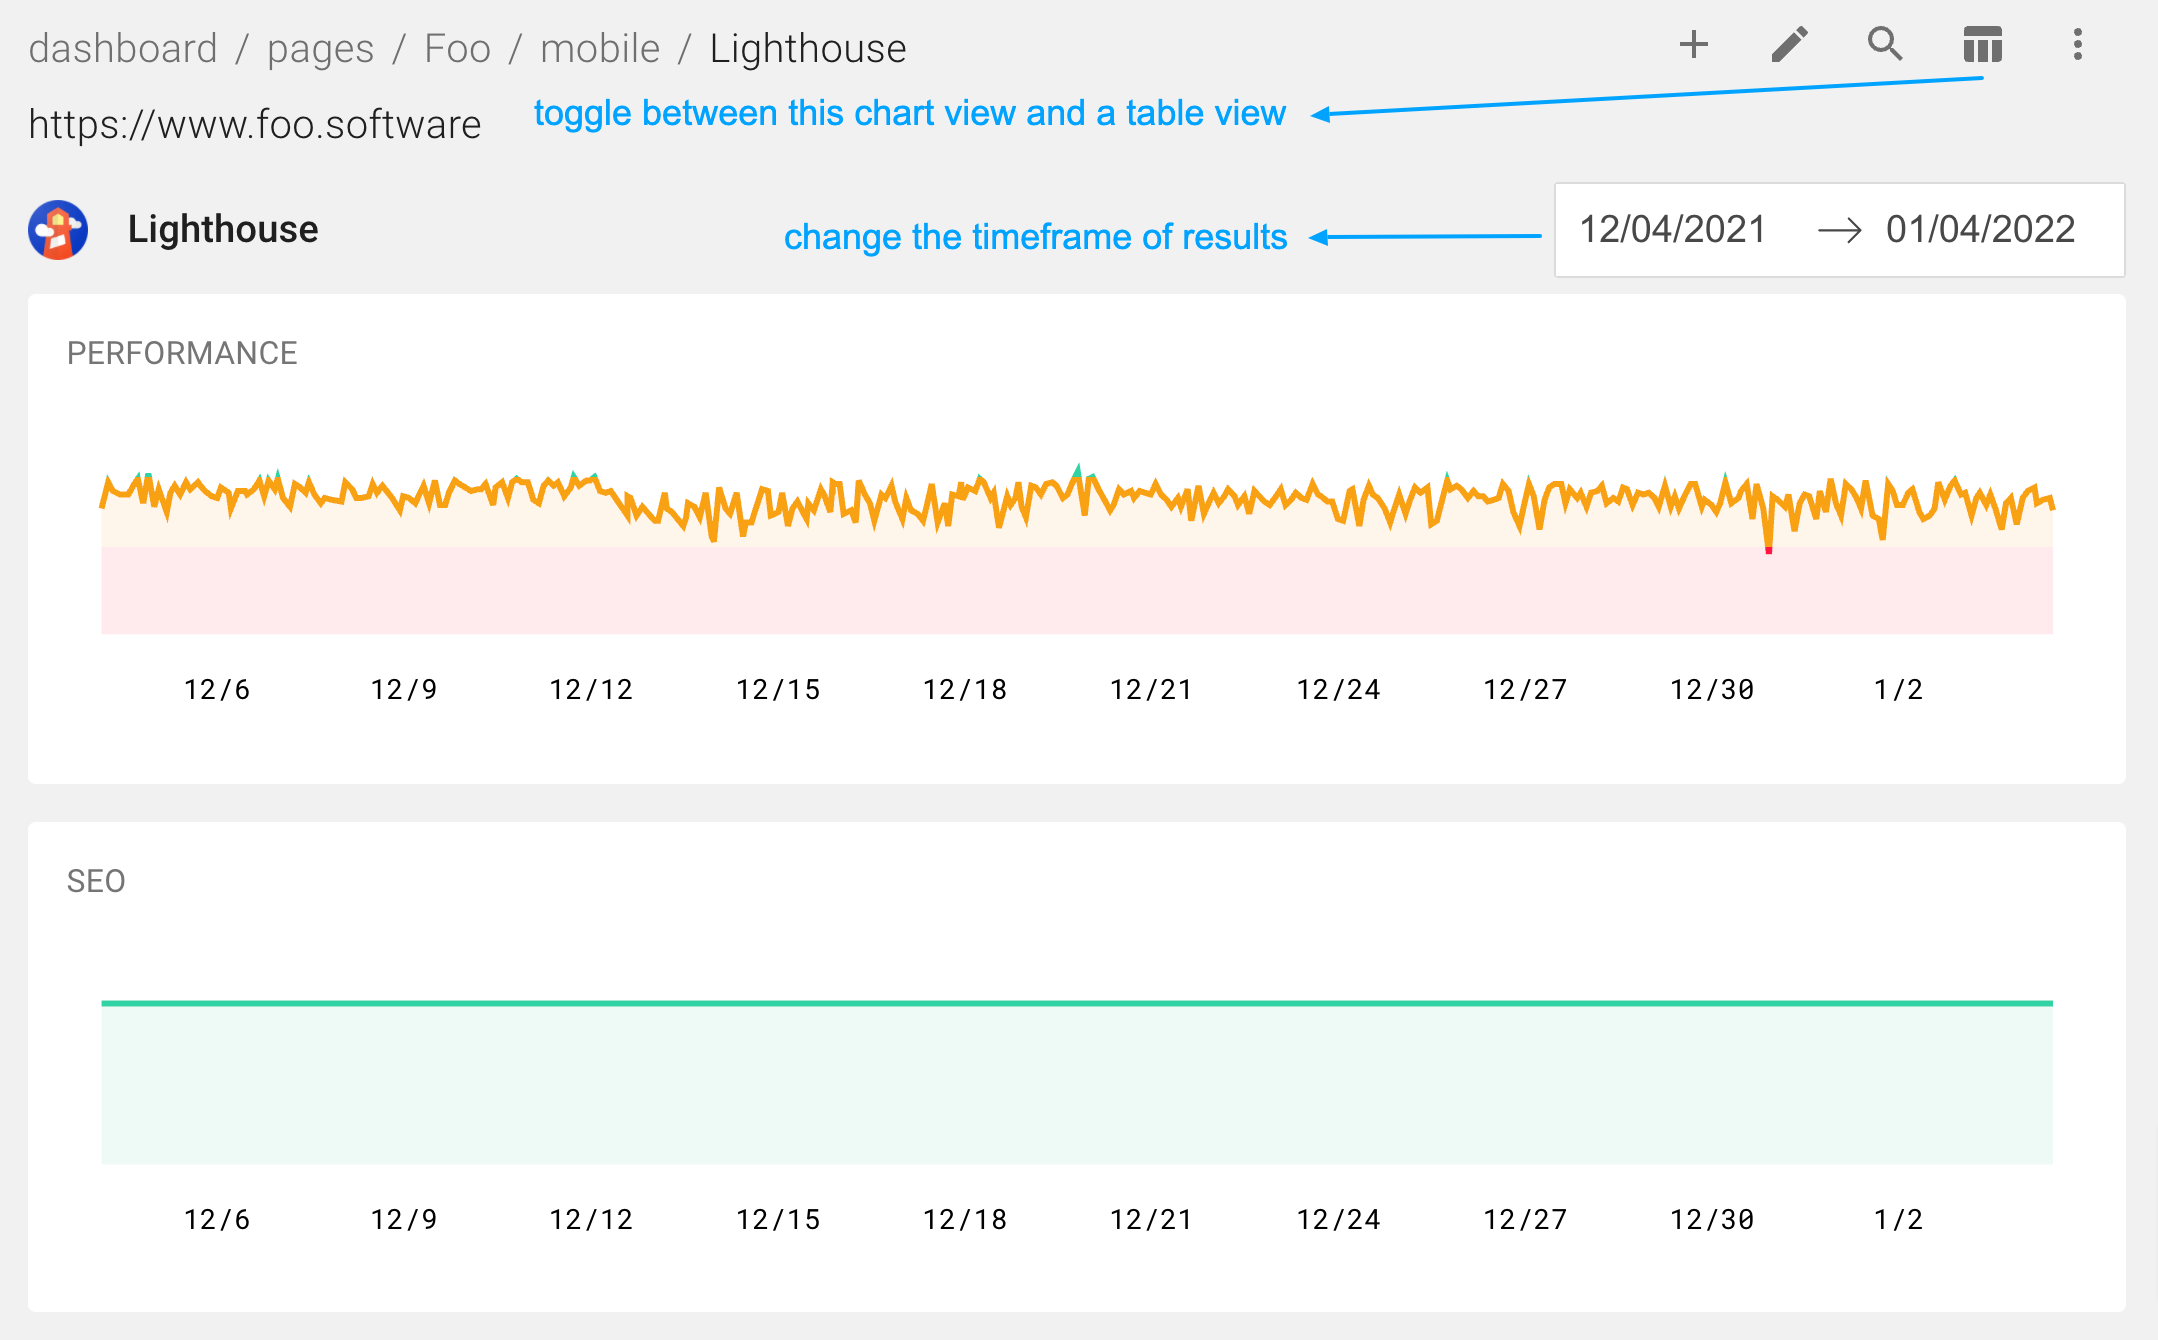
Viewing Detailed Lighthouse Audit Results
Going back to the Lighthouse section of the page dashboard described above, you can drill into a detailed view for a page and device by clicking the chart icon.

Upon clicking the icon button above, you'll find a detailed view of Lighthouse audits for the corresponding page and device. You can always toggle devices from the icon on the top right.
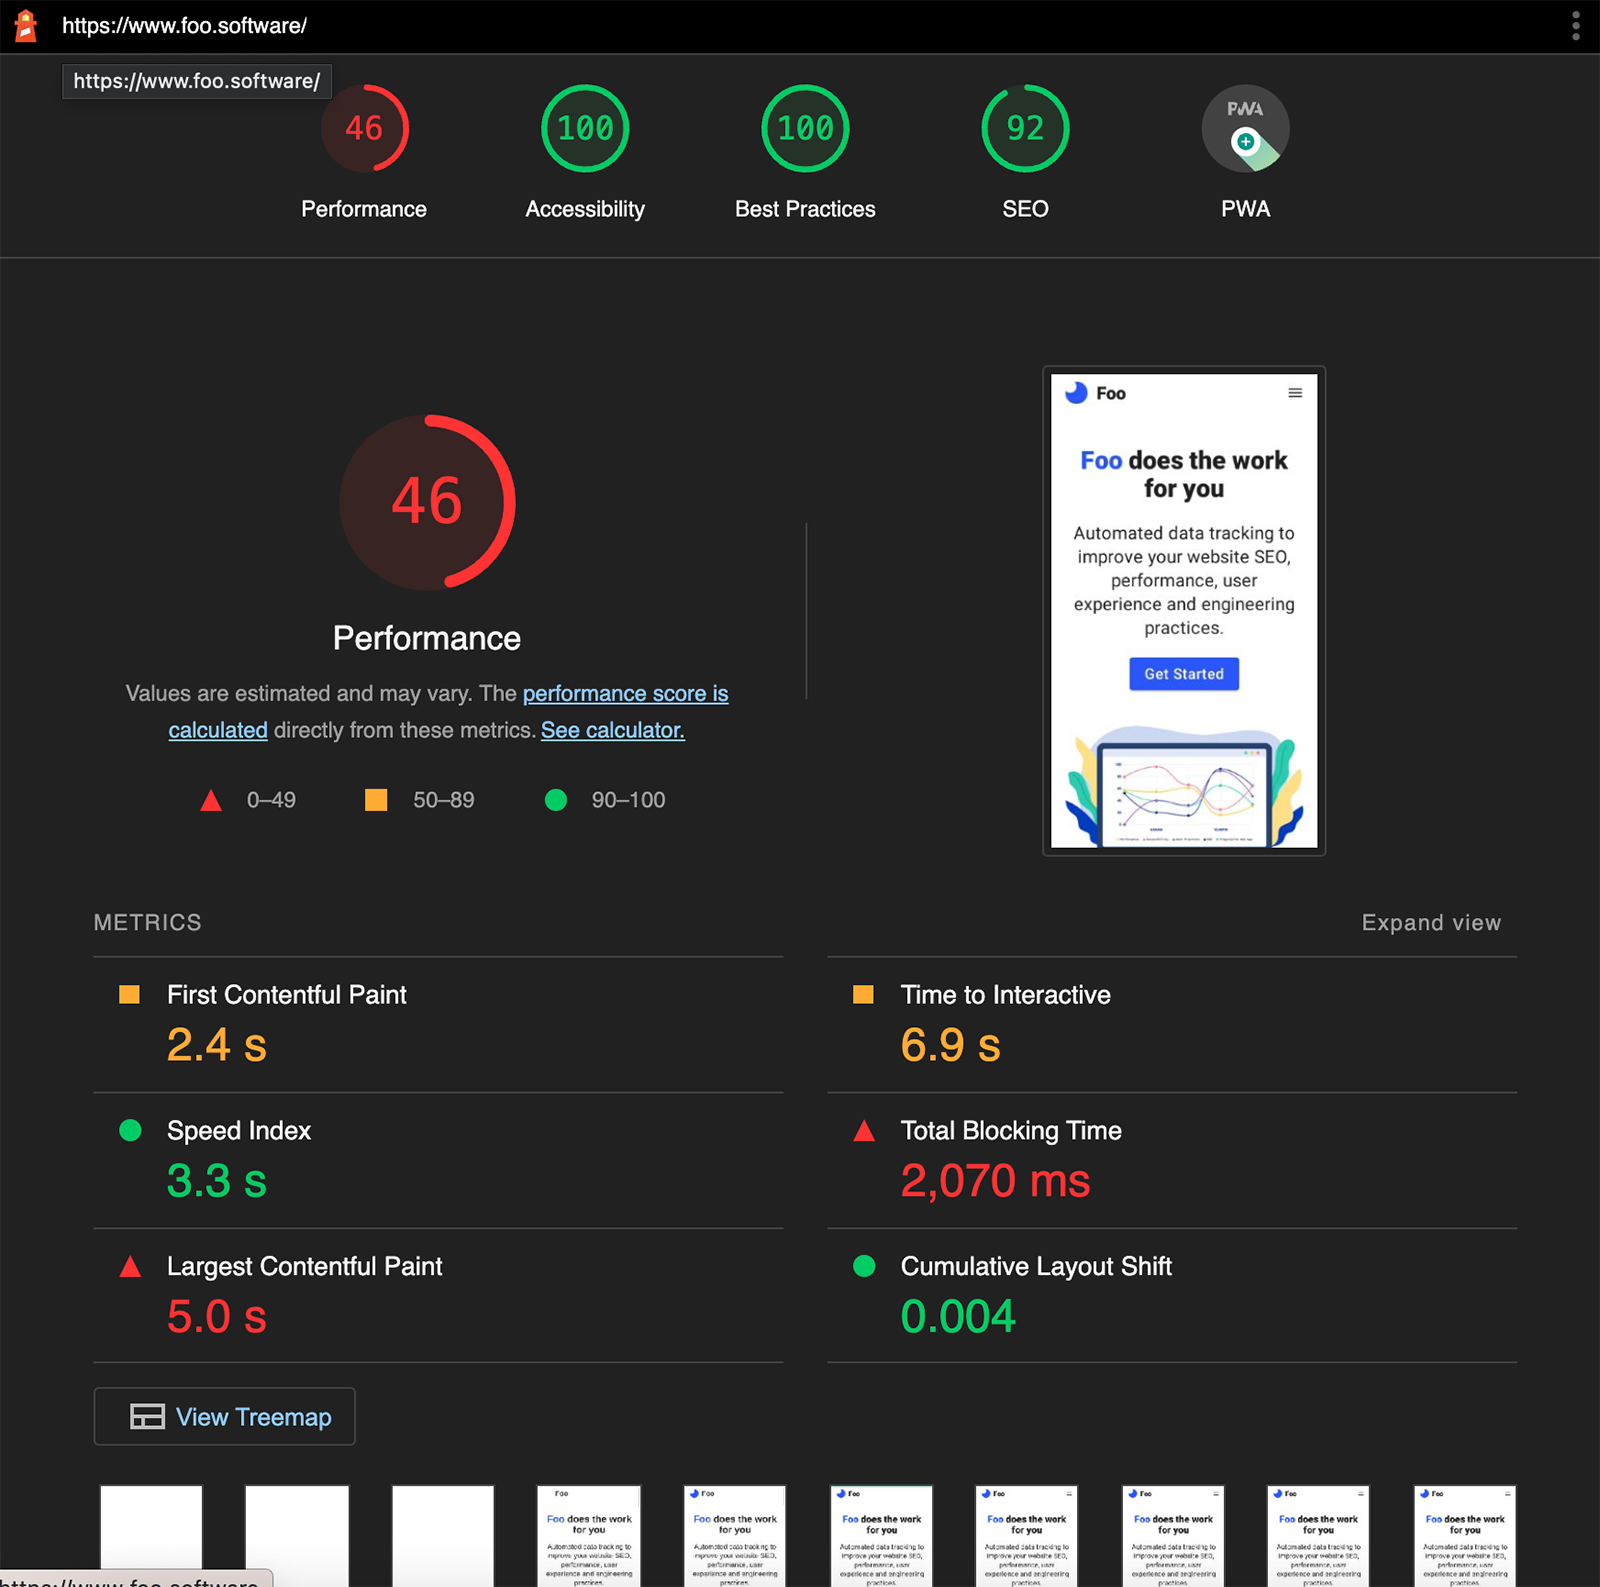
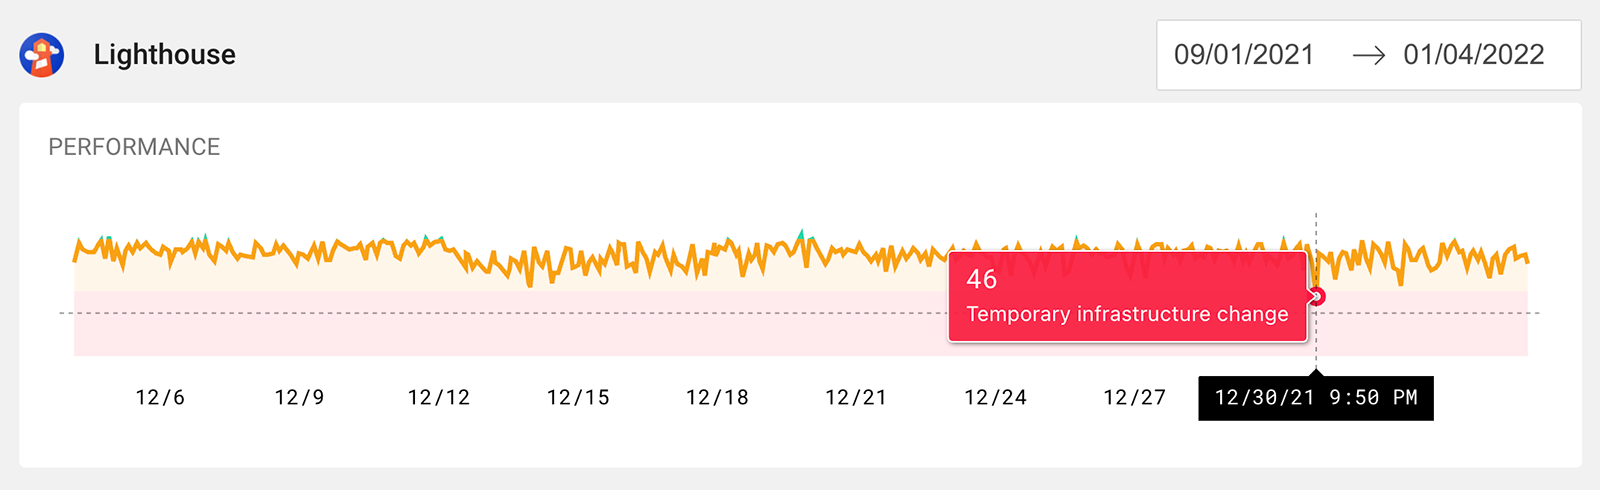
Upon hovering over any point in the chart, you will see the corresponding score popup and upon clicking a modal will open. This modal shows a screenshot and provides a link to the full Lighthouse report you may be familiar with.
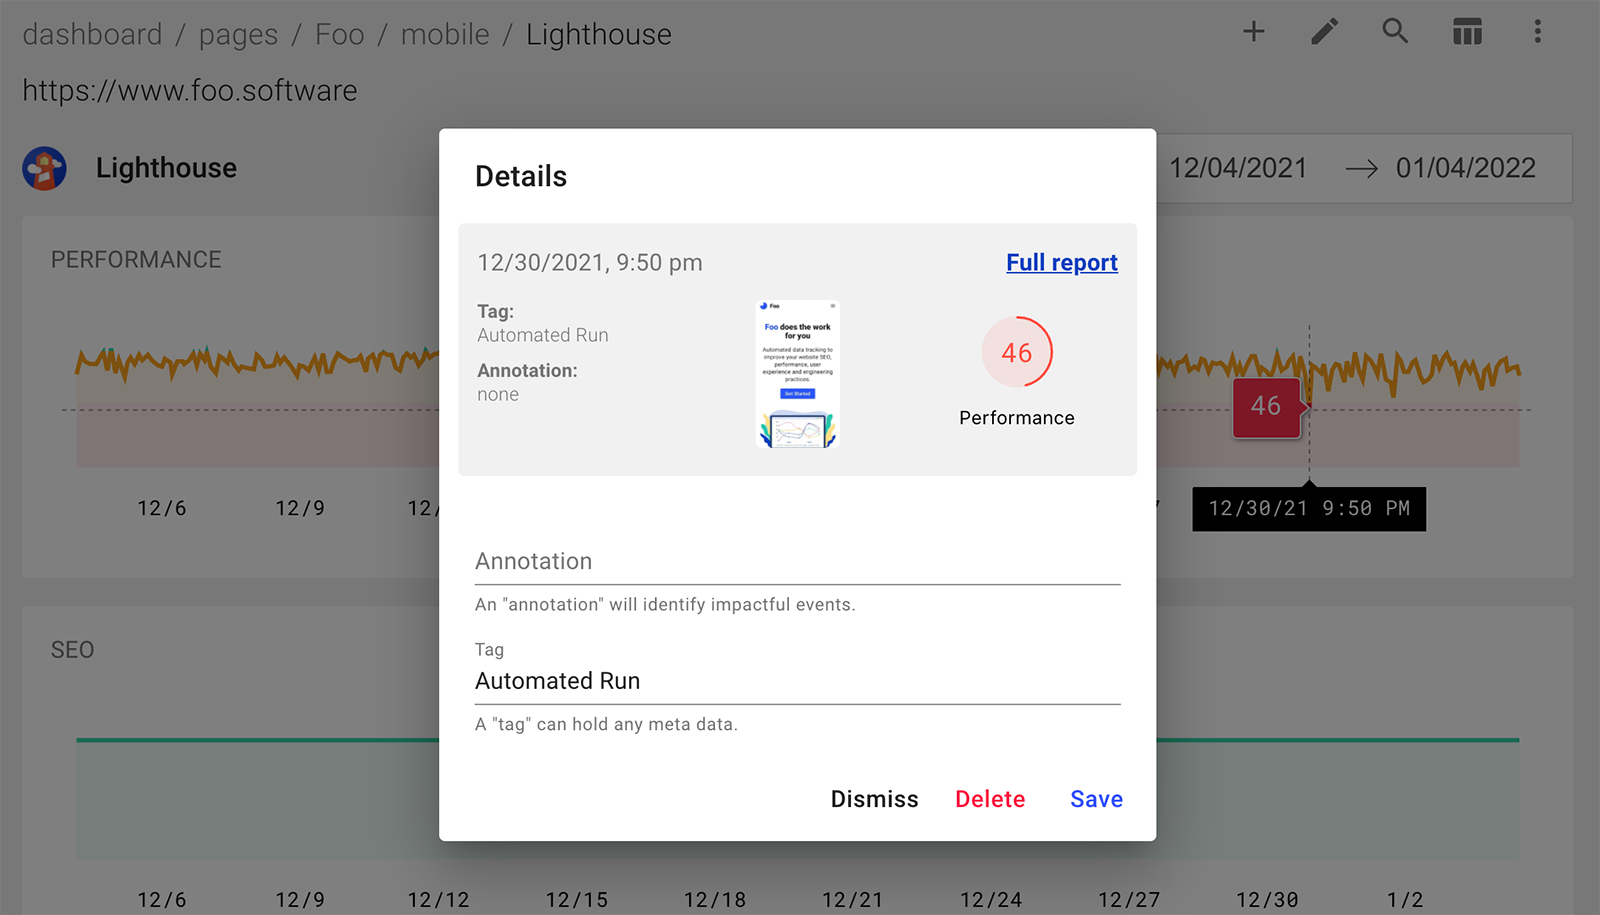
Within the modal you can add "tags" to be visible in tabular views and "annotations" that will show as points on the chart.
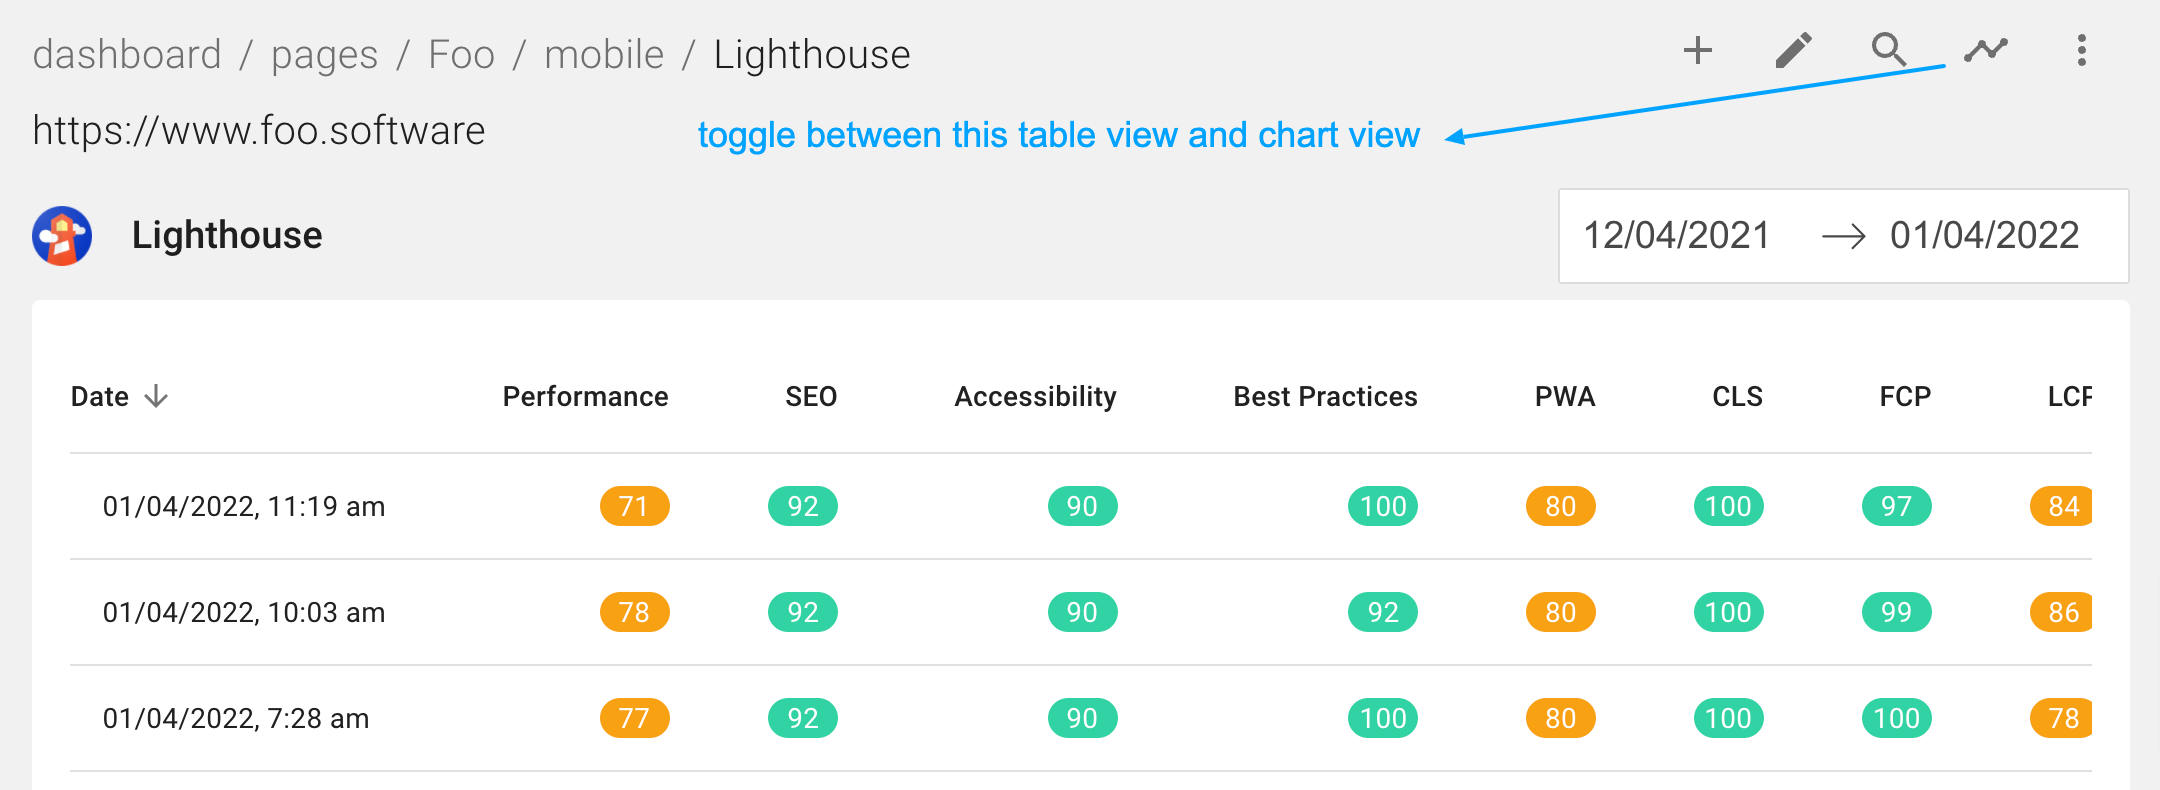
You can also view Lighthouse results in a table view by toggling the table icon button at the top right. This will show data a bit more granularly and allow for sorting.
Conclusion
I hope this tutorial was helpful. For more tidbits about using our services, checkout the tutorial page.